Hi everyone,
I’ve been working on experimental source map support for the ReScript compiler and would appreciate feedback from people trying it in real projects.
You can install a compiler build from this PR using the instructions here:
After installing that compiler, enable source maps in your rescript.json:
{
  "sourceMap": {
    "enabled": "dev",
    "mode": "linked",
    "sourcesContent": true
  }
}
The enabled field controls when source maps are generated:
-
"dev": generate source maps duringrescript watch -
"always": generate source maps during bothrescript buildandrescript watch
For development, "dev" is usually the recommended setting. If you want source maps from rescript build as well, use "always".
This currently generates linked Source Map v3 files:
src/App.res → src/App.js
src/App.js.map
and appends a sourceMappingURL comment to the generated JS.
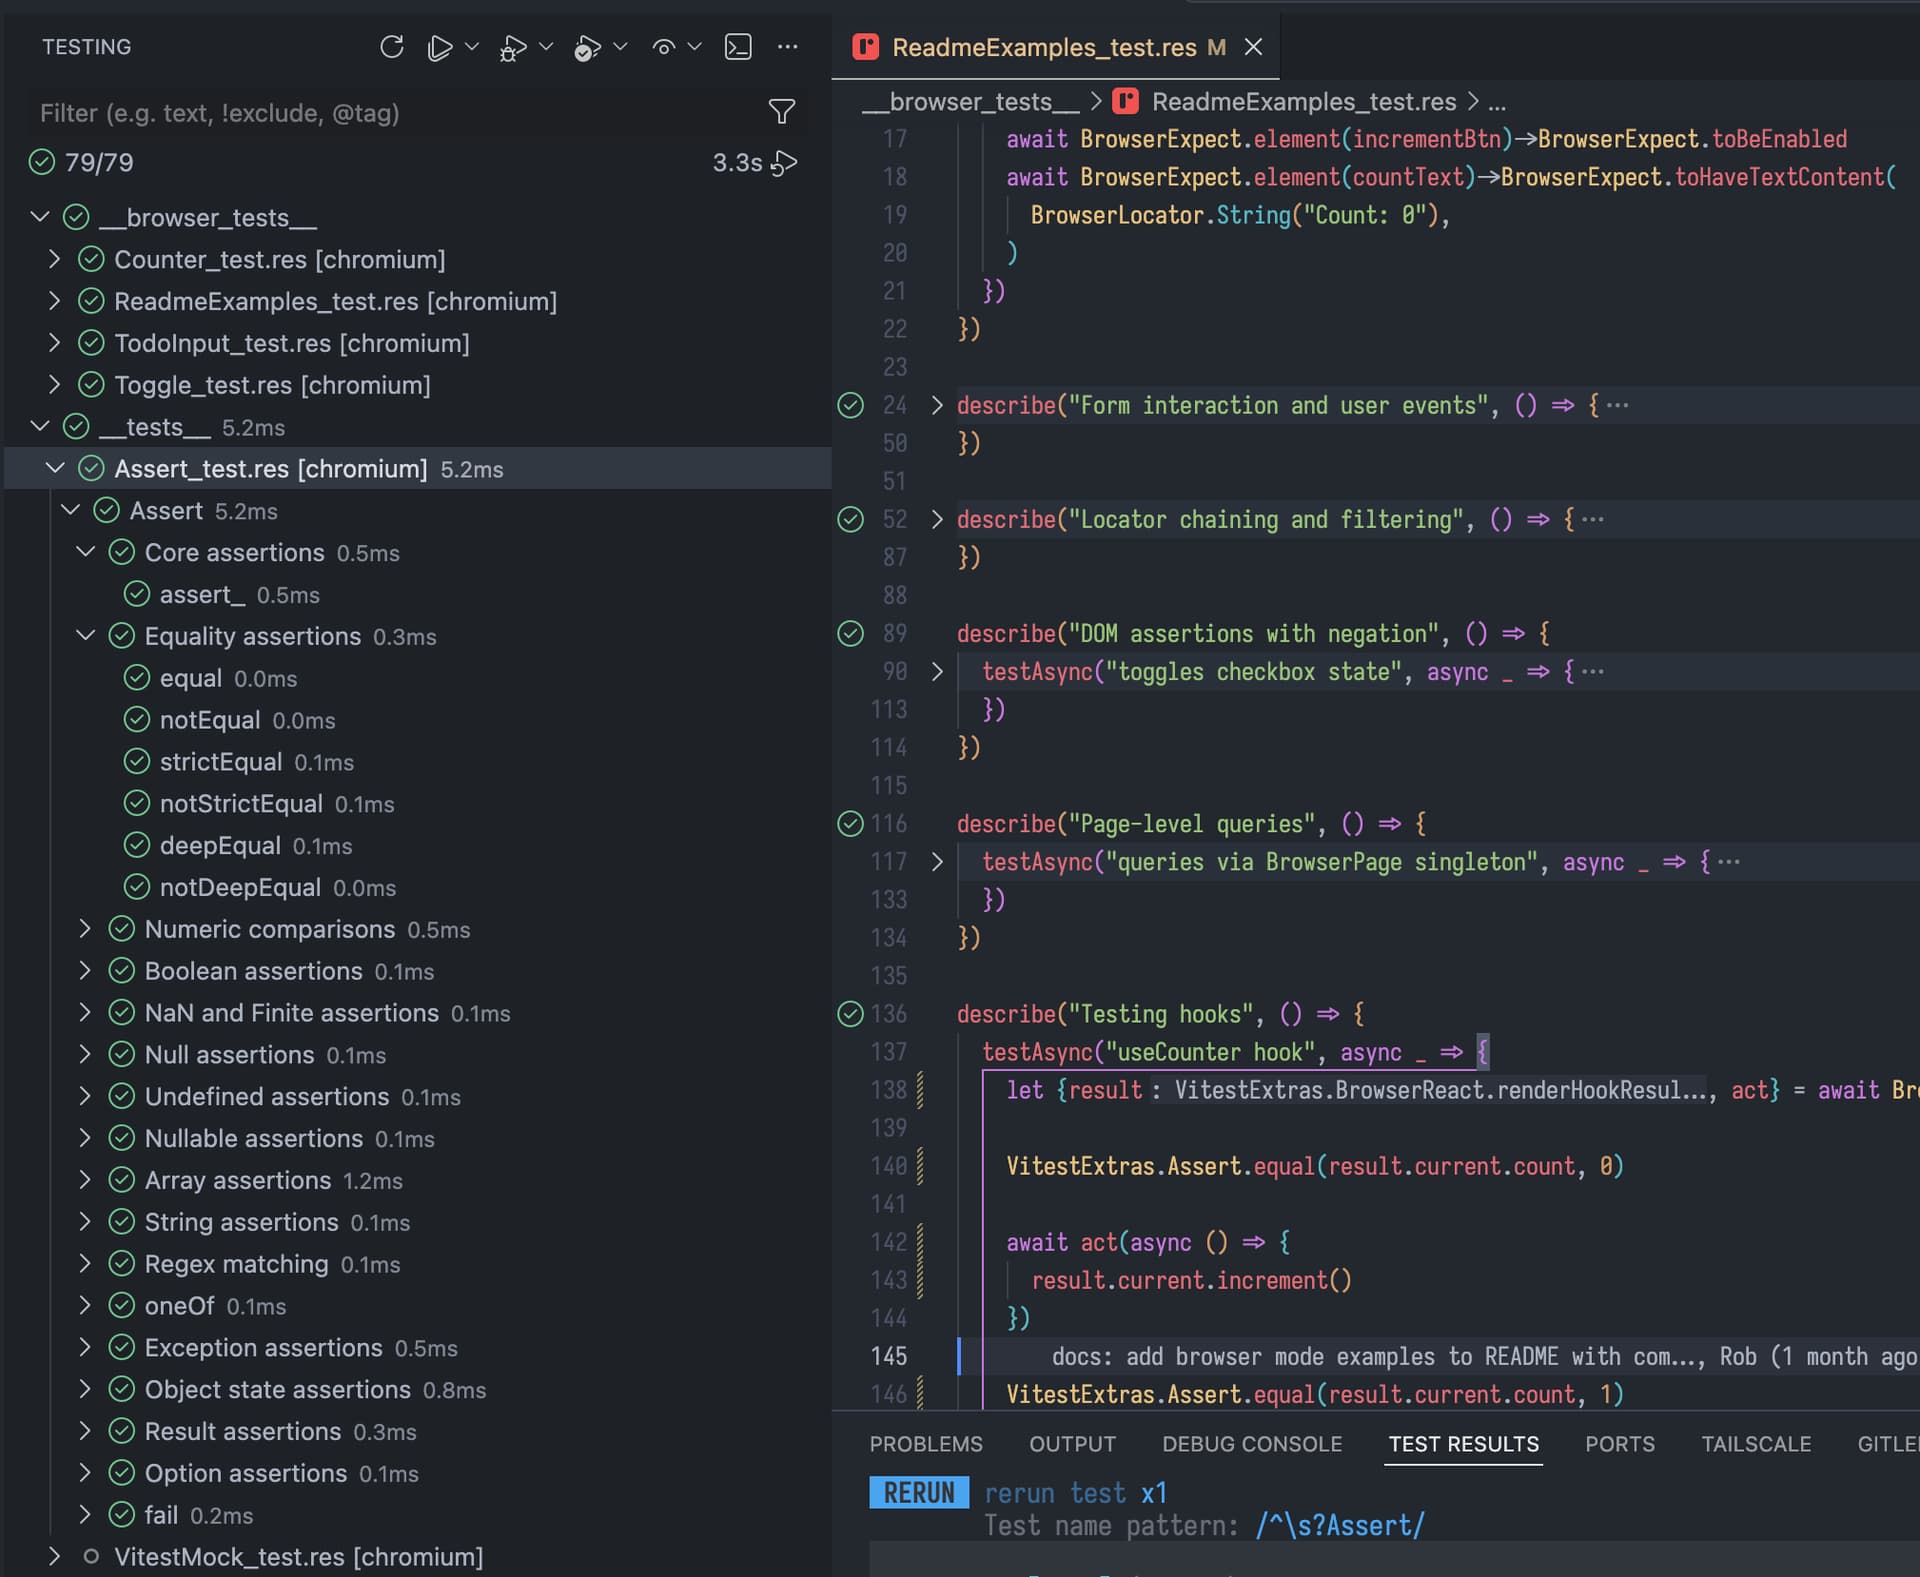
To test it in the browser:
- Build or run your app as usual.
- Open browser DevTools.
- Go to the Sources tab.
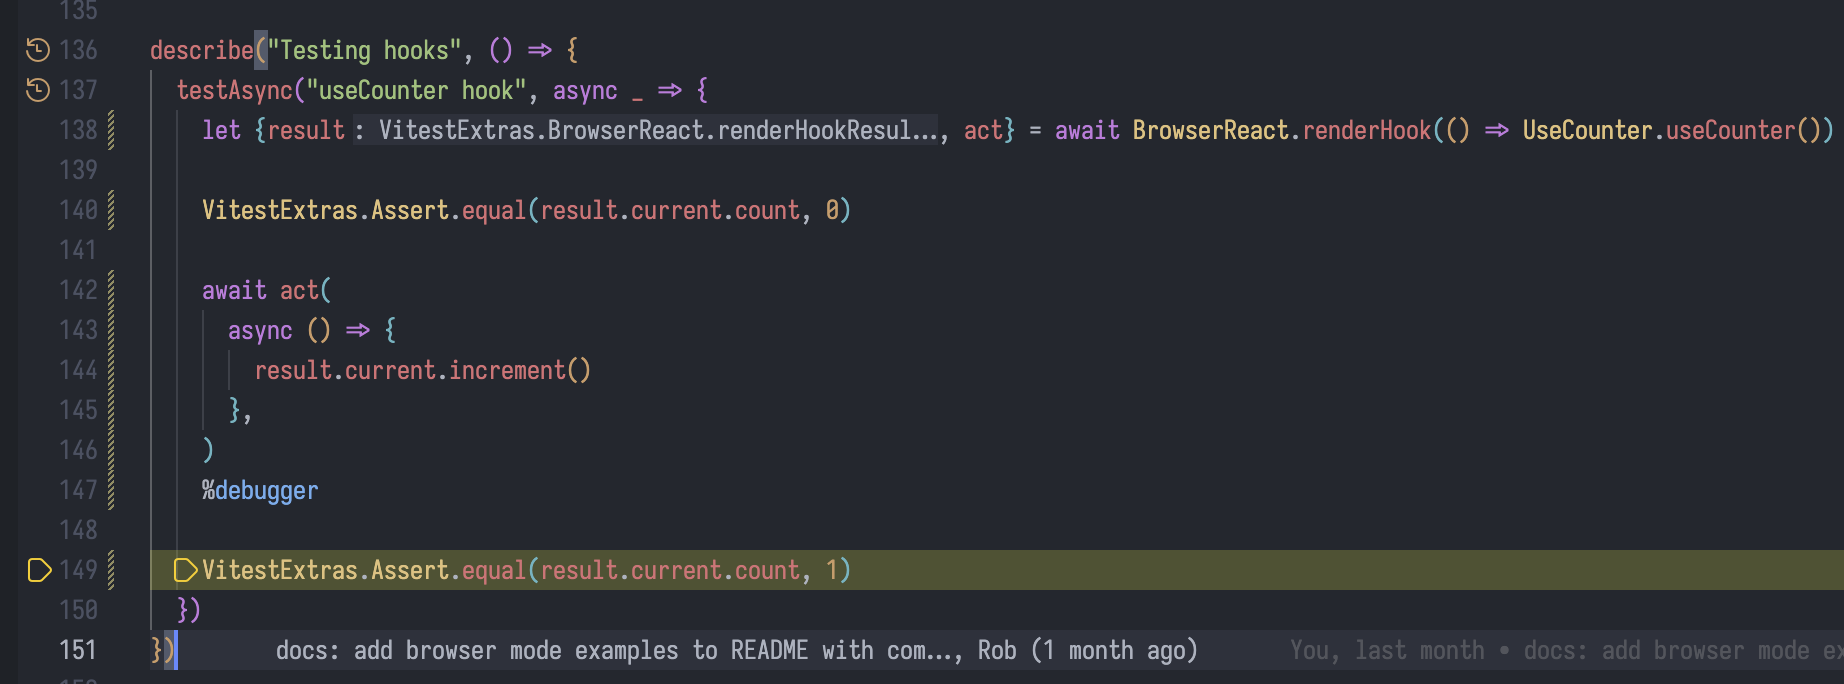
- Search for your .res files.
- Try setting breakpoints directly in .res code.
- Trigger the relevant code path and check whether the breakpoint / stack location maps back correctly.
For Vite projects, there is one extra step for now: Vite needs to receive the ReScript-generated input source maps through a small plugin in vite.config.js.
You can use this test project config as a reference:
The important part is that the plugin loads each generated .js file together with its sibling .js.map file and returns both to Vite:
function rescriptInputSourceMaps() {
  return {
    name: "rescript-input-source-maps",
    enforce: "pre",
    async load(id) {
      if (!id.endsWith(".js") || !id.includes("/src/")) {
        return null;
      }

      try {
        const code = await readFile(id, "utf8");
        const map = JSON.parse(await readFile(`${id}.map`, "utf8"));
        return { code, map };
      } catch {
        return null;
      }
    }
  };
}
Then add it to your Vite plugins:
export default defineConfig({
  plugins: [rescriptInputSourceMaps()],
  build: {
    sourcemap: true
  }
  ...
});
For this MVP, the plugin is written manually in the Vite config. Longer term, the plan would be to provide this through an official package such as @rescript/vite, so users would only need to install the package and add the plugin instead of copying this code.
For Node, you can also try:
node --enable-source-maps src/YourFile.js
or:
NODE_OPTIONS=–enable-source-maps node src/YourFile.js
I’m especially interested in feedback around:
- whether .res files appear correctly in DevTools
- whether breakpoints bind to the right lines
- whether stack traces point back to .res files
- behavior with Vite / Rollup / Webpack / esbuild
- Unicode / emoji / non-ASCII source locations
- cases where the generated location feels confusing
This is still an MVP. At the moment the focus is linked source maps for development/debugging. Other modes like inline or hidden source maps can be considered later.
If you try it, please leave feedback here or comment on the PR with your setup and anything that worked or failed.